
Macro Pakistani started off with a basic understanding of the CIGXM of the Pakistani economy and now we will move on to breaking down each of the components to identify structural issues that existed before 2020. We can discuss 2020 in detail later when discussing the future economic plan, as part of the IMF program, and how we were performing against it.
Last time, we saw where Pakistan stands compared to other countries in terms of private consumption (C). Now, let’s see how this has changed over the years, how economic growth has been impacted and how prices have varied as a result. Also, keep in mind something someone super important once said:
“In order to serve this higher demand at the same prices, suppliers need to innovate or else, increase prices.”
-Macro Pakistani
You don’t care if you make me unhappy
Let’s go back to you – as a seller, with limited past investment and lack of innovation. Except now, let’s give you multiple buyers. The population of our country has grown and now there are more people demanding your shirts. This is good for you because you get to make more money without making yourself more efficient. You will not care if you make me unhappy by increasing prices.
As long as someone else is willing to pay more than PKR 1,000 for the shirt, you will sell it to them instead of to me. Because I know that you have the option to sell it to others, I will keep my unhappiness to myself and buy the shirt at PKR 1,500 because I know other people will buy it too. Higher demand with the same supply leads to an increase in price whereas a lower supply with the same demand leads to an increase in price too.
Where does our money go?
Pakistan’s Consumption and GDP per capita (1990-2019)
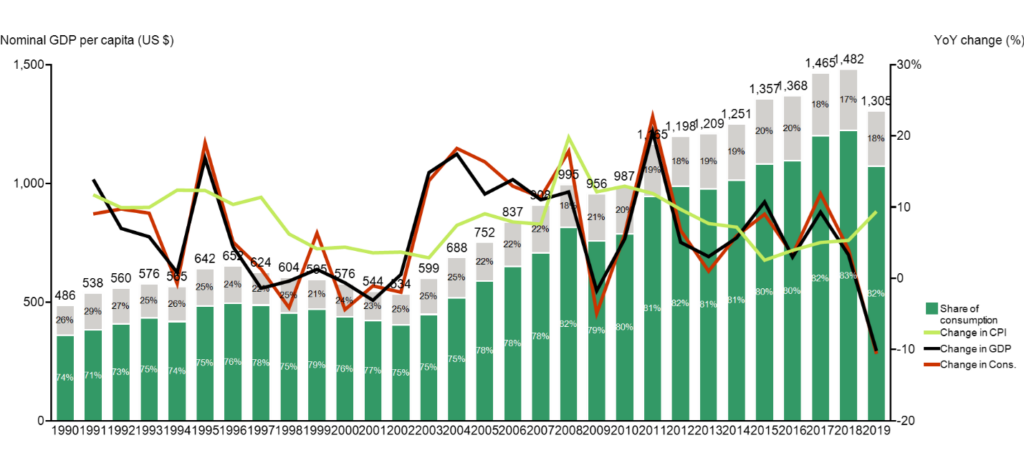
Green usually signifies something positive but here, that is not the case.
Since 1991, consumption has made up 75-80% of our GDP consistently. So much so that you can hardly see the difference between the black line (change in GDP) and the red line (change in consumption). What this means is that your GDP growth mostly came from consumption, and as a consequence, not from other factors such as investment. In addition, notice that the light green line, which shows change in Consumer Price Index (inflation), does not seem to be following any trend.
In 1990, the average Pakistani spent US$486 out of which roughly 75% was spent on private consumption. After 28 years, in 2018, they spent US$1,482 (nearly US$1,000 more) out of which they spent even more (83%) on consumption.
This explains how Pakistan consumes faster than its income grows since consumption now makes up an even larger chunk of an average citizen’s income than it did in 1990. Now you will say, prices increased and people became more hand to mouth which is why they ‘had to’ spend more of their income on consumption.
But if you look at the graph closely, you will see inflation starts growing after consumption increases, not before. Specifically, the light green line is an output rather than an input for the red line. Because there are more people like me who are demanding the shirt, you are making all of us unhappy because you have not innovated and cannot provide more goods at the same price.
You don’t have to make me unhappy
Now I am not saying the only reason prices have increased through the years is that demand for goods has increased. I also said ‘you are’ making us unhappy and not ‘you have to’. Like you, there are many large companies in Pakistan who prefer to ‘rent seek’ rather than invest and become more efficient.
Rent seeking is basically when companies get to play with the forces of demand and supply rather than leaving it up to the market to decide, and hence maximize their profits that way. In simple terms, you know your power as the only supplier of shirts and you will use that power to squeeze me as much as possible, just because you can. We will discuss this in a lot more detail later.
Let’s stick to inflation for now and understand it a bit more. What you hear on the news and is typically reported is the Consumer Price Index or headline inflation. Pakistan reports this on a monthly basis and actually reports it by different income levels too.
You can tell how much of the burden of increased prices was borne by the lowest 20% of income earners making less than PKR 8,000 vs. the highest income earners making more than PKR 35,000. Pause and let that sink in: if you make more than PKR 35,000 in Pakistan, you are among the richest 20% of the country.
Pakistan’s annual change in Consumer Price Index or Inflation (2009-2019)
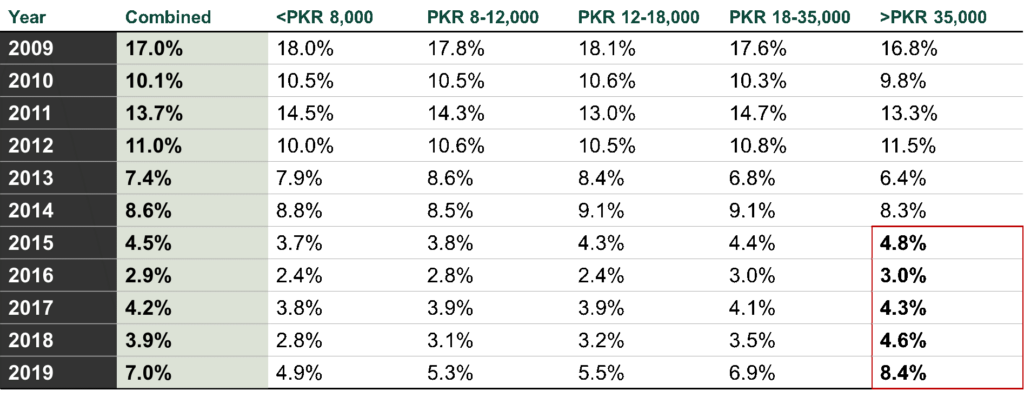
As you can see in the table above, for the last few years, the highest quintile of income earners have been disproportionately bearing the burden of inflation. In 2019, while the political rhetoric was mainly around how the poor are getting poorer and the rich are getting richer, the rich were actually experiencing higher price increases (8.4%) than all the other quintiles (7.0%). This is because the prices of goods they consume, for e.g. imported goods, increased as the dollar became more expensive. The lowest quintile experienced inflation that was more than 2% less than the national average and has been better off since 2015.
Rich Dad Poor Dad
Allow me to explain this point a bit more through the findings of a fantastic household survey Pakistan conducts every few years.
Pakistan’s Consumption as a share of income by Urban/Rural (2014-2019)
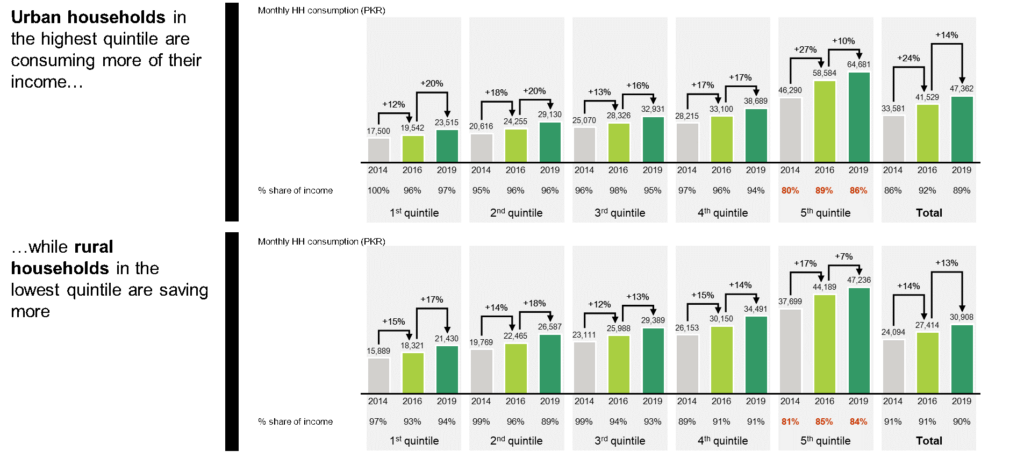
The richest urban households consumed PKR 46,290 per month in 2014 which was 80% of their income, while their poorest counterparts in quintile 1 consumed PKR 17,500 which was 100% of their income – the true definition of hand to mouth. In 2016 however, the rich started consuming 89% of their income, consuming faster than their income grew. The lowest quintile, on the other hand, started saving more, consuming 96% of their income and becoming less hand to mouth. The trends were similar in rural areas and remained the same in 2019.
A point that you should have already noticed in the graph was that both the urban and rural households, in totality, consumed around 90% of their income in 2019 (extreme right on the chart), which is different from the 82% we have mentioned for private consumption as a portion of GDP before. If you caught that, congratulations! If not, then pay more attention!
The difference mainly comes from the fact that the 82% includes only private consumption and excludes imported goods since they are not counted in the GDP of Pakistan. Additionally, the household survey will never be an exact math since it is conducted by going door to door to just over 24,000 households to get a representative sample of the entire country, which actually happens to have 34 million households.
Roti, Kapra aur Makaan
Let’s try to understand what it is that these people are consuming. To simplify, I broke down consumption patterns into food and non-food items:
Pakistan’s Consumption per household by quintile (2019)
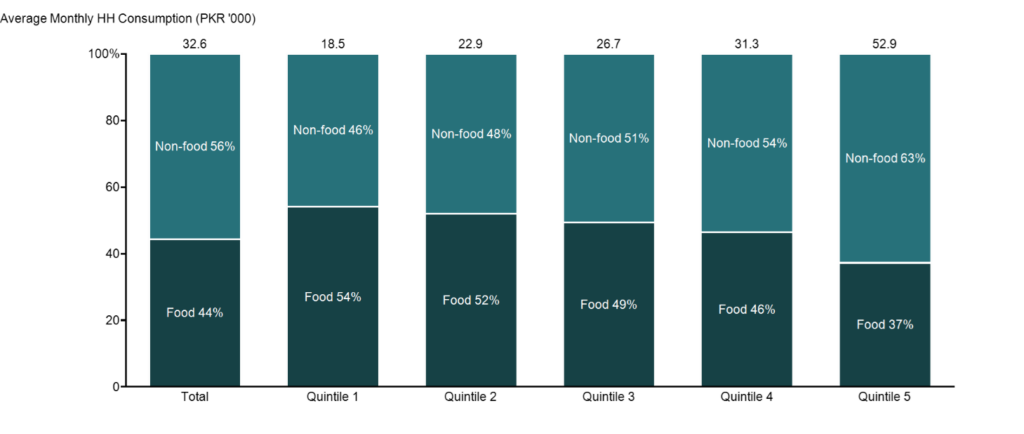
The average Pakistani household in 2019 consumed PKR 32,578 of goods and services per month out of which 44% was spent on food and the rest on non-food items like clothing and housing.
Remember the lowest quintile experienced inflation of roughly 5% compared to the national average of 7%? This was because the bulk of their consumption (54%) is on local food, the prices of which did not rise by much. The higher quintiles, which spend less on food and more on non-food items (63%), suffered more as the exchange rate was devalued and not only the imported cheese they consume, but also the cars and the fuel they put in them, became more expensive.
In terms of non-food consumption, Pakistanis spend a lot specifically on housing. Rich urban households spend more on housing than lower income households do. When I say housing, I do not mean building of new houses since that is included in investment that we will discuss later. By housing, I mean expenditure on rent for those who rent, and utility bills. For those who live in owned houses, the ‘declared’ value of your property is taken into account to calculate imputed rent but that is not important. Just know that a certain rent is included and it makes up a significant chunk of your consumption.
I am sure some people are thinking but rents abroad are so high. How can we be spending more? Let us compare to other countries:
Global comparison on private consumption by category (2019)
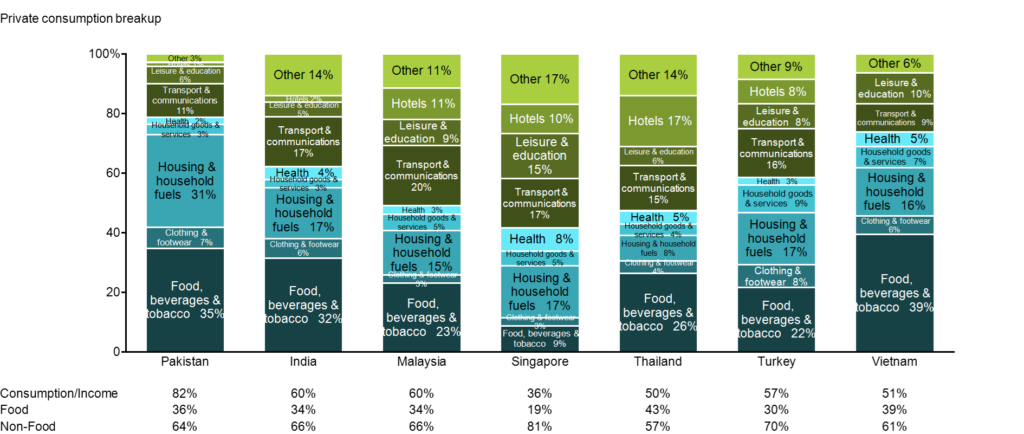
If we just look at private consumption and exclude imported consumption, Pakistanis spend the highest proportion of their income on housing and household fuels (electricity, water) out of all comparable countries. While low-middle income countries like India and Vietnam are expected to spend a higher proportion of income on food, Pakistan spends almost twice as much on housing as its peers.
Over 30% of our private consumption is housing related compared to India’s 17% and Vietnam’s 16%. This is why they can afford to save up to 40% of their incomes and invest for the future, and we cannot.
Naya Pakistan is starving
We will talk about the housing sector later but you should already start to create links in your mind. Pakistan is a consumption driven economy and hence is starved of investment. Because of the lack of investment in, for e.g. housing infrastructure and efficient electricity distribution, citizens have to spend more on housing services. Because they have to spend more of their limited income on housing, they cannot save. Since they cannot save, the country cannot invest.
The political rhetoric maintains that the poor is getting crushed while the rich is out to just rent seek. There is no mention of Consumer Price Index by income quintiles that shows that the poor have actually started to save a bit more. There are headlines around ‘Naya Pakistan Housing Scheme’ and the circular debt related to electricity production and distribution (both topics we can cover in detail later), but no one explains why they are important.
There is a need to explain what kind of loss a lack of infrastructure causes and how it puts Pakistan in a constant cycle of consumption leading to lack of investment leading to more consumption.
Through several different angles, we have discussed how Pakistanis are consuming more of their income and how inflation has influenced it. Next, we will talk about incomes, how they have grown and what role, if any, investment has had to play in their growth.
Excellent analysis, informative content with engaging explanation. In fact data you have used helpful in my thesis. Great job