A few people reached out and said Macro Pakistani didn’t talk about how Pre-COVID-19, tax collection by the government in March 2020 was 17% higher than last year and fiscal position was improving. These responses highlight the issue of thinking about breaking news and not the real story – exactly what MP is looking to tackle. A 17% increase should not be the focus when you eventually miss the original target for 2020 by ~30%. We will ramp up to talking in more detail about government revenues and expenses, but for now, let’s continue taking a big picture view on Pakistan’s economy and the problems it faces.
What were the structural issues facing Pakistan pre-COVID-19?
A nice way to breakdown these structural issues is to go through the different aspects of GDP, think deeply about what is problematic within each and then how they are connected with each other:
Consumption (C): Our economy consumes faster than our income grows which means we do not save enough.
Investment (I): Because we do not save enough, we do not invest enough in improving our overall productivity, which has issues across all sectors of the economy.
Government Expenditure (G): If incomes don’t rise fast enough, government has to continue spending more than it earns in taxes. This leads to recurring deficits, which have to be financed, which require interest to be paid the next year, leading to more deficits.
Government Expenditure (G): If incomes don’t rise fast enough, government has to continue spending more than it earns in taxes. This leads to recurring deficits, which have to be financed, which require interest to be paid the next year, leading to more deficits.
How have high levels of private consumption affected Pakistan?
If you have read the last article, you will know if your population is increasing, you will have higher demand. In order to serve this higher demand at the same price, suppliers need to innovate or else, increase prices
Where does our money go?
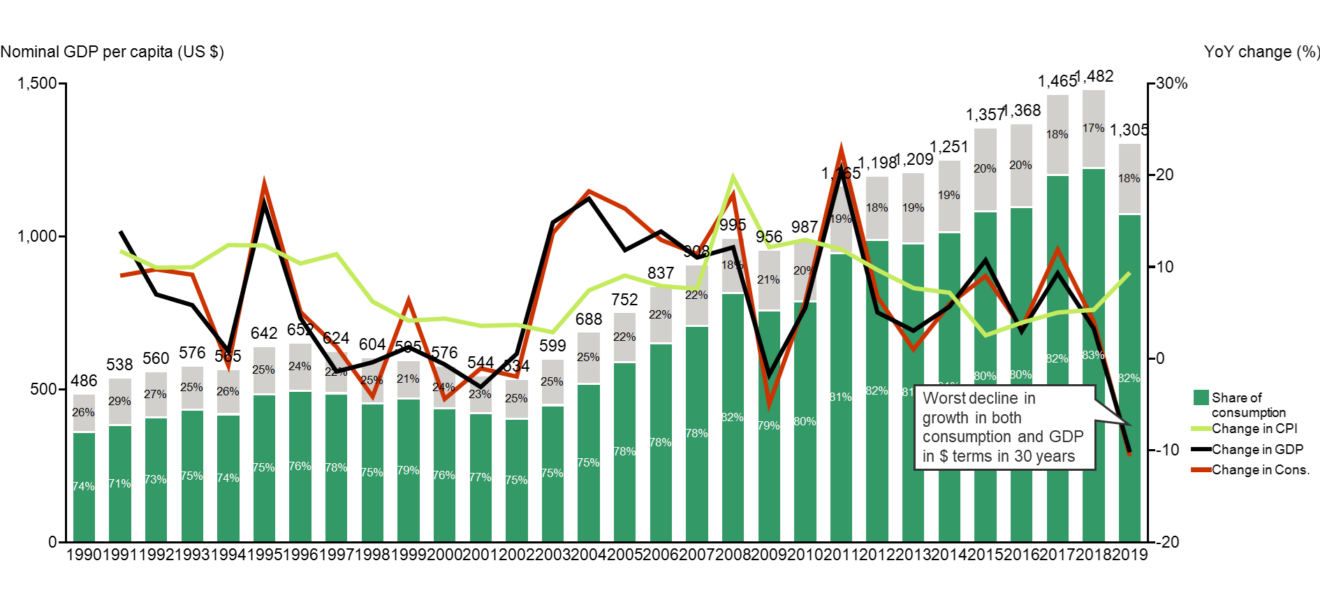
Source: Economist Intelligence Unit
Since 1991, consumption has made up 75-80% of our GDP consistently and most growth in the past has been consumption-led – you can hardly see the difference between the black line (change in GDP) and the red line (change in consumption). In 1990, the average Pakistani spent US$486 out of which roughly 75% was spent on private consumption. After 28 years, in 2018, they spent US$1,482 (nearly US$1,000 more) with 83% spent on consumption.
You make me unhappy
With high levels of consumption and lack of improvement in productivity, you will experience inflation (light green line). To figure out whom this inflation affects the most, you can explore how much of the burden of increased prices was borne by the lowest 20% of income earners making less than PKR 8,000 vs. the highest income earners making more than PKR 35,000. Pause and let that sink in: if you make more than PKR 35,000 in Pakistan, you are among the richest 20% of the country.
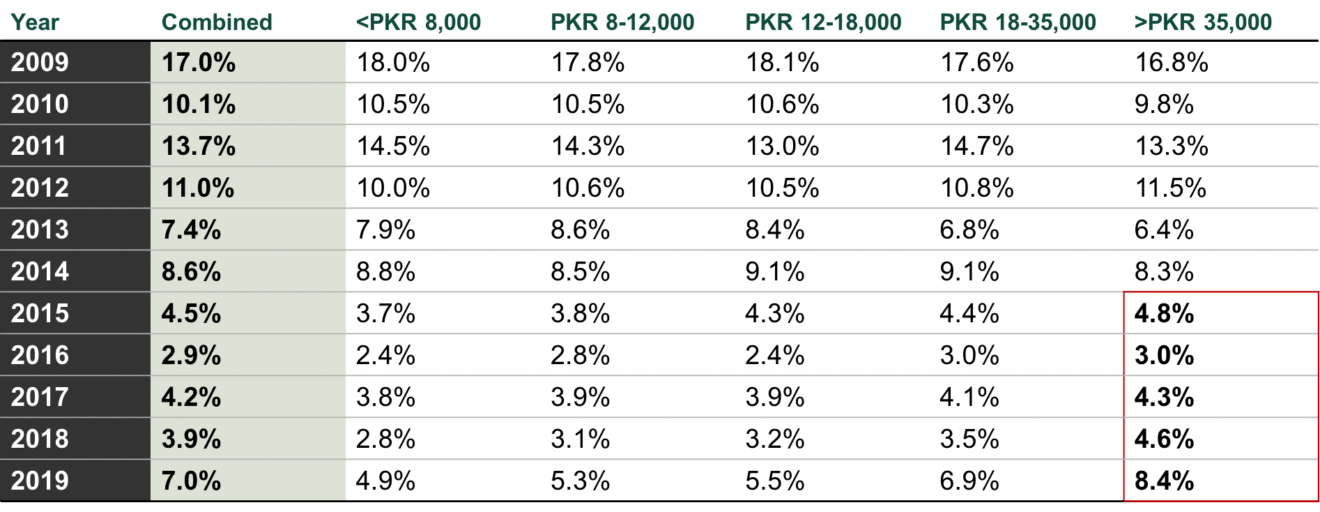
Note: Base year 2007-08 Source: Pakistan Economic Survey 2018-19
As you can see in the table above, for the last few years, the highest quintile of income earners have been disproportionately bearing the burden of inflation. In 2019, while the political rhetoric was mainly around how the poor are getting poorer and the rich are getting richer, the rich were actually experiencing higher price increases (8.4%) than all the other quintiles (7.0%).
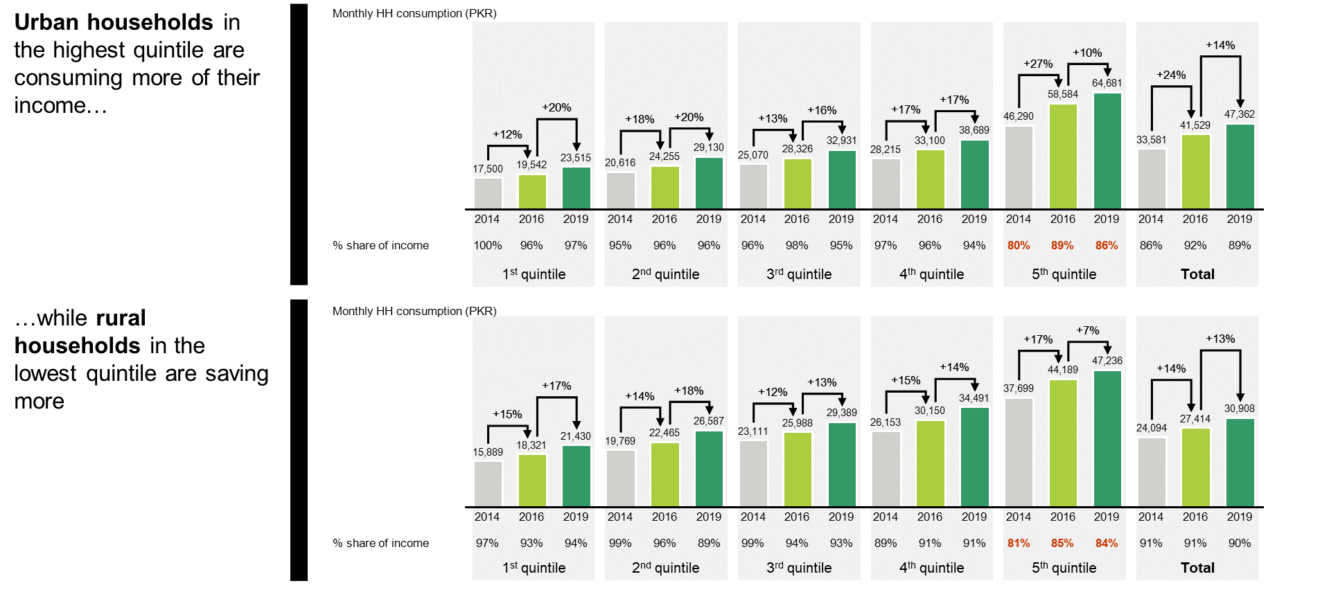
Source: Household Integrated Economic Survey 2018-19
How this affects households is that they will have to spend more of their income on consumption if prices increase. In 2014, the richest urban households consumed PKR 46,290 per month, which was 80% of their income, while their poorest counterparts in quintile 1 consumed PKR 17,500, which was 100% of their income – the true definition of hand to mouth. In 2016 however, the rich started consuming 89% of their income, consuming faster than their income grew. The lowest quintile, on the other hand, started saving more, consuming 96% of their income and becoming less hand to mouth. The trends were similar in rural areas and remained the same in 2019.
Roti, Kapra aur Makaan
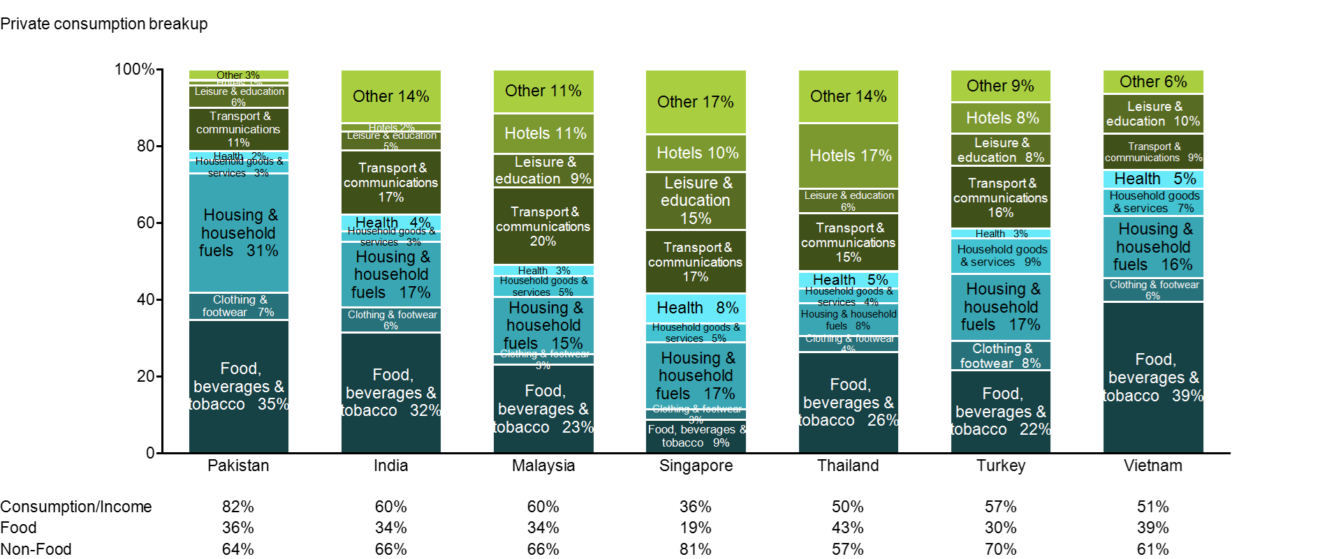
Source: Economist Intelligence Unit
Read the complete article below if you want to see what the rich and the poor spend their money on. The main takeaway will be that the higher quintiles spend more on non-food consumption than the lower quintiles. Additionally, Pakistanis spend the highest proportion of their income on housing and household fuels (electricity, water) out of all comparable countries. While low-middle income countries like India and Vietnam are expected to spend a higher proportion of income on food, Pakistan spends almost twice as much on housing as its peers.
Over 30% of our private consumption is housing related compared to India’s 17% and Vietnam’s 16%. This is why they can afford to save up to 40% of their incomes and invest for the future, and we cannot. There are headlines around ‘Naya Pakistan Housing Scheme’ and the circular debt related to electricity production and distribution, but no one explains why they are important.
There is a need to explain what kind of loss a lack of infrastructure causes and how it puts Pakistan in a constant cycle of consumption leading to lack of investment leading to more consumption. We hope Macro Pakistani can address that need as best as possible.
Read the full article in the link below
How have high levels of private consumption affected Pakistan
Deep dive into the structural issues facing Pakistan with a focus on private consumption as part of the Macro Pakistani series on the economy.
If you have any feedback on this newsletter or the website itself, feel free to reply to this email. You can also share the entire article and even selected excerpts by simply highlighting the text on your own profiles!