Not Just a Bad Winter
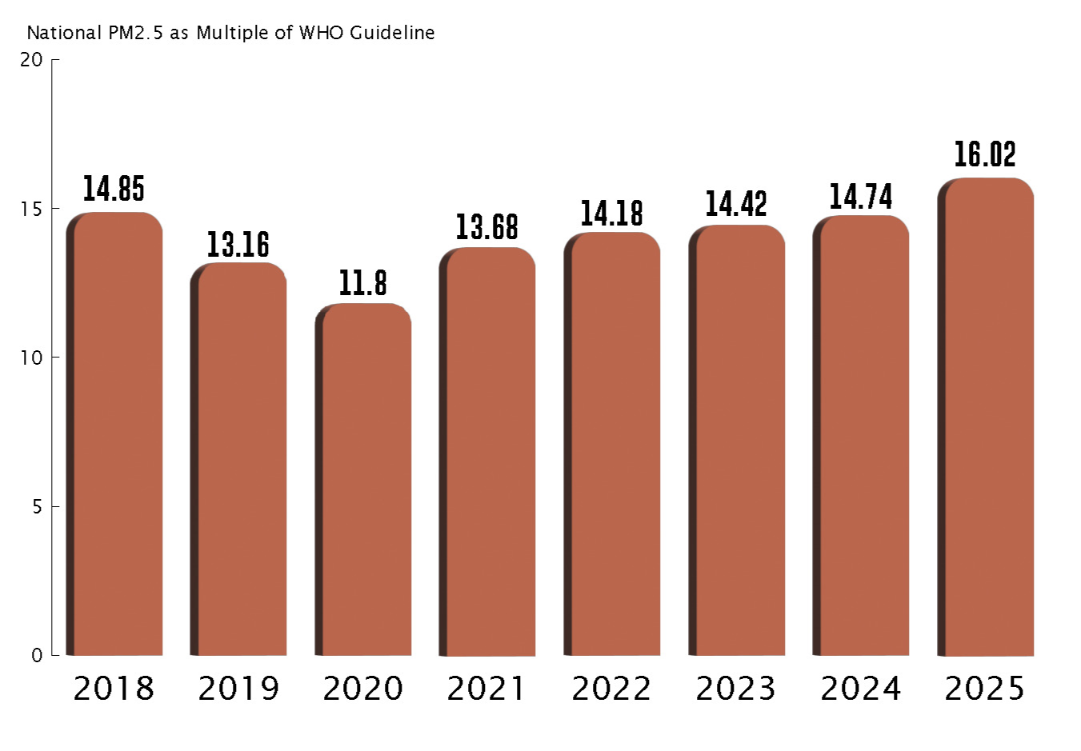
Pakistan’s air quality crisis is not a seasonal alarm – it’s a sustained one. National PM2.5 concentrations have run at approximately 12 to 16 times the WHO guideline every year since 2018, and 2025 was the highest national average since then. In 2024, Pakistan was ranked the third most polluted country in the world.
Pakistan’s National PM2.5 Relative to the WHO Annual Guideline, 2018–2025
https://www.kaggle.com/datasets/alitaqishah/pakistan-air-quality-index-10-cities-20152025
The distortion in the phrase “smog season” becomes clear once you look month by month rather than year by year.
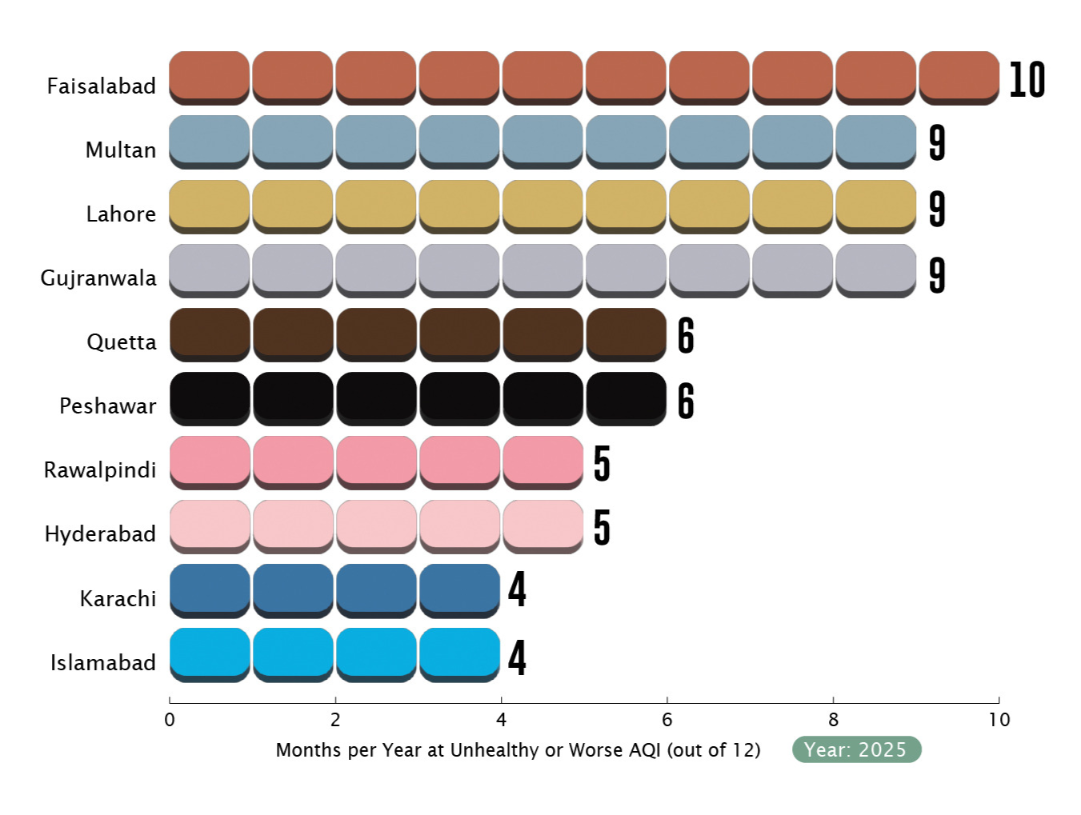
In 2025, Faisalabad spent ten of twelve months at unhealthy AQI levels or worse; Multan, Lahore, and Gujranwala each spent nine. This isn’t a six-week winter emergency that clears with the first spring rain. For Punjab’s major cities, unhealthy air is closer to the default state than a disruption to it.
Months per year Spent at Unhealthy AQI or worse, Major Punjab cities, 2025
https://www.kaggle.com/datasets/alitaqishah/pakistan-air-quality-index-10-cities-20152025
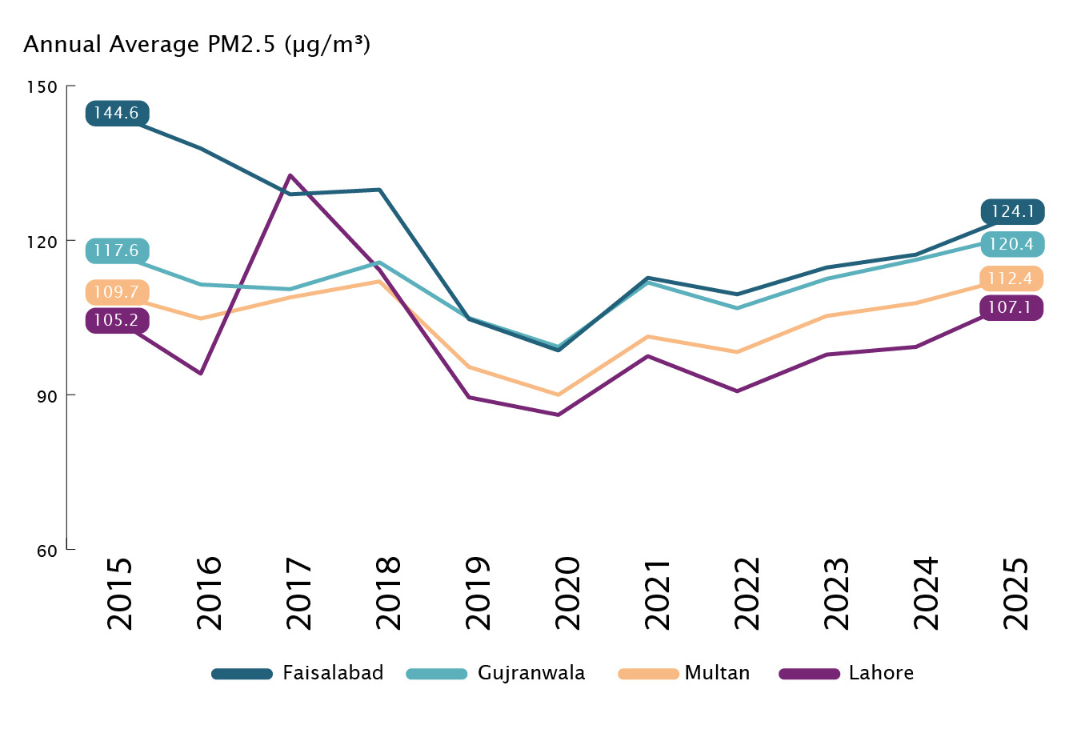
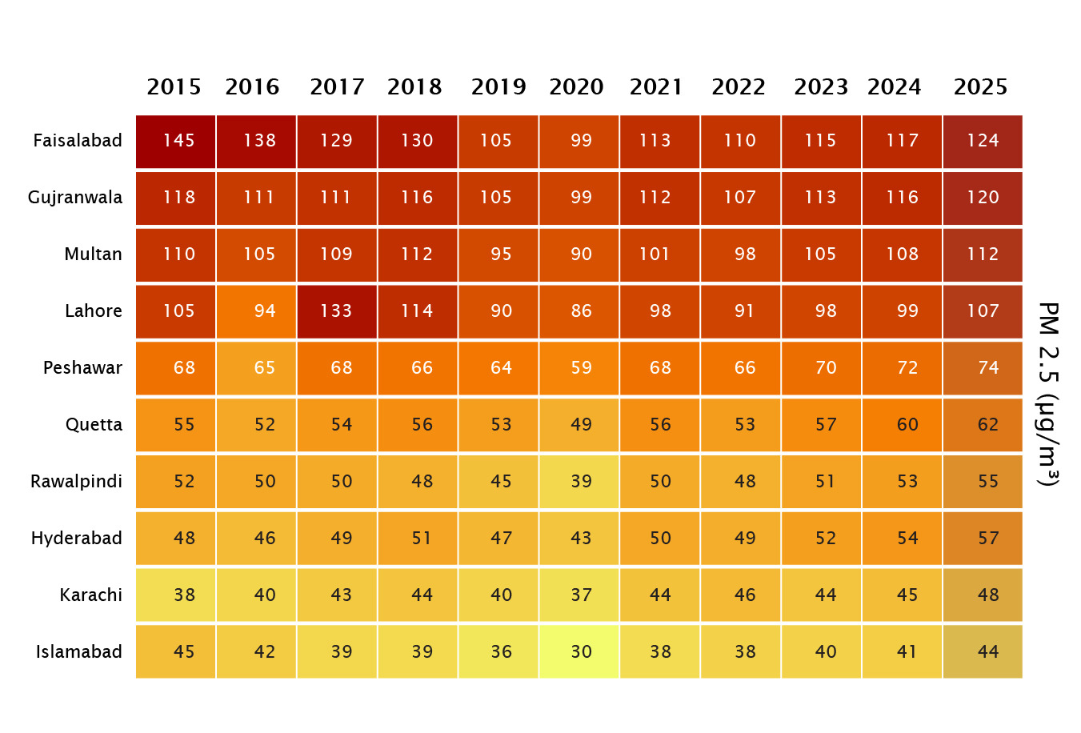
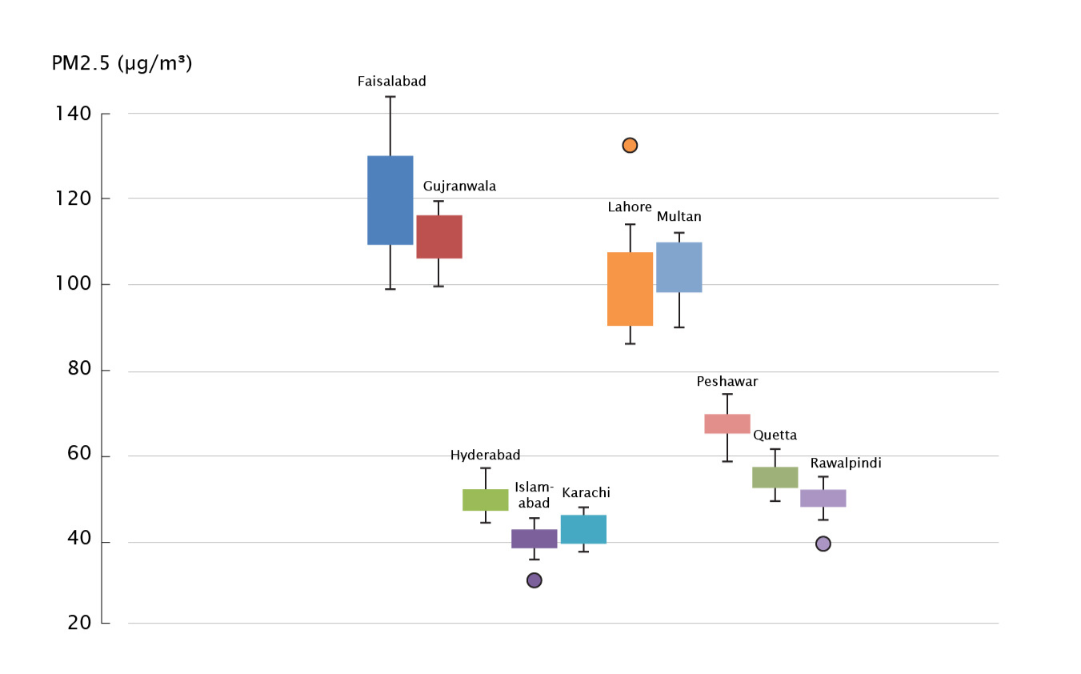
As is true for most other developments in the country, the burden of smog is distributed unevenly. Around a decade of city-level PM2.5 data (2015–2025) shows the same four cities – Faisalabad, Gujranwala, Multan, and Lahore – sitting well above the rest of the country year after year, typically between 85 and 145 µg/m³, compared to 38–48 µg/m³ in Karachi and Islamabad.
Annual average PM2.5, Faisalabad, Gujranwala, Multan and Lahore, 2015-2025
https://www.kaggle.com/datasets/alitaqishah/pakistan-air-quality-index-10-cities-20152025
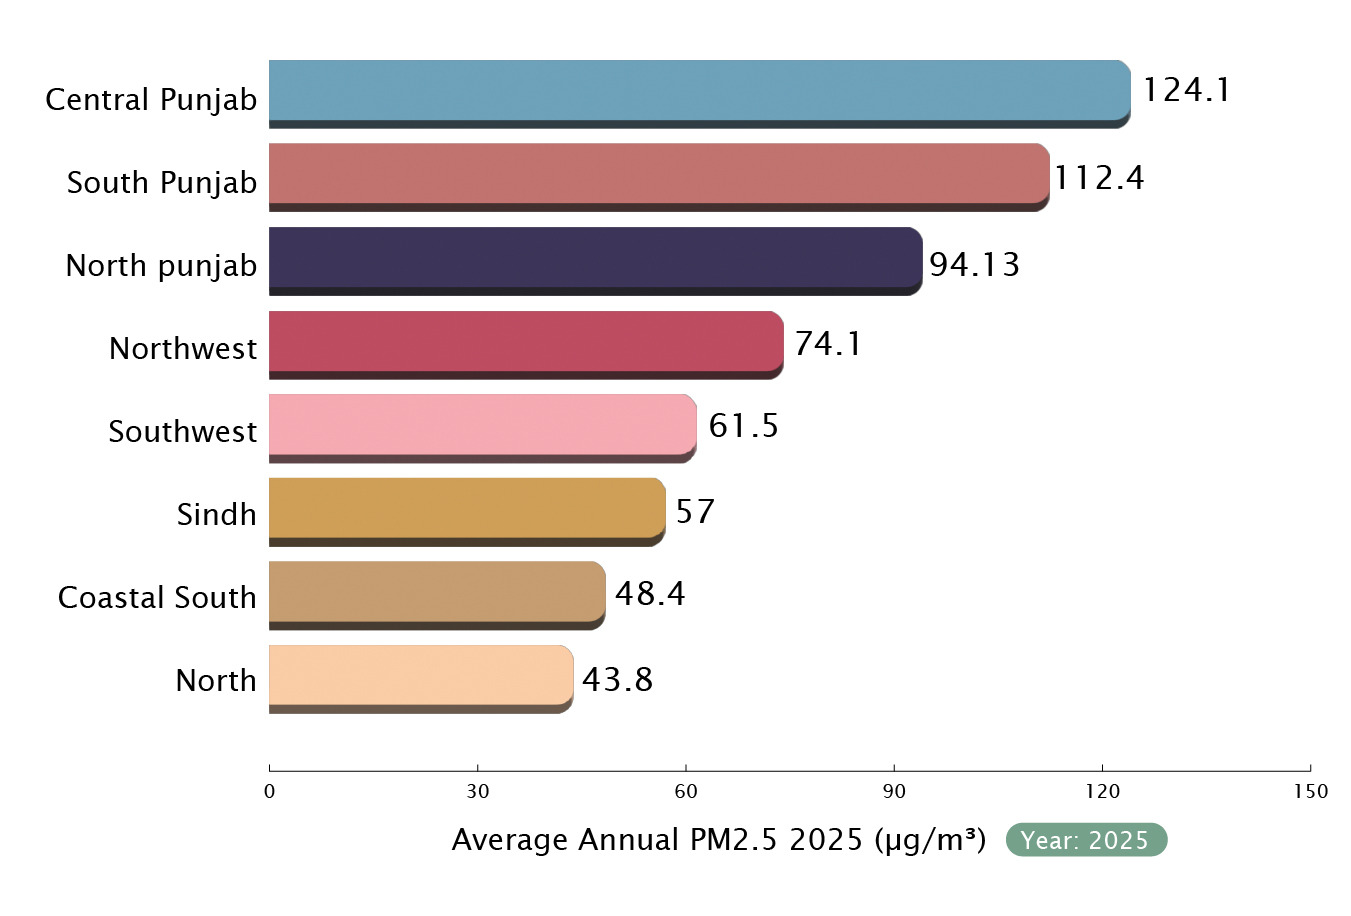
Within Punjab, the pattern follows the industrial belt. In 2025, Faisalabad, the province’s textile hub, averaged roughly 124 µg/m³, ahead of South Punjab (about 112 µg/m³) and North Punjab (about 94 µg/m³). Islamabad, by comparison, averaged about 44 µg/m³, roughly a third of Faisalabad’s level.
Pakistan’s smog problem maps closely onto its economic engine.
PM2.5 Distribution and City-by-Year Heatmap, 10 Pakistani cities, 2015–2025
https://www.kaggle.com/datasets/alitaqishah/pakistan-air-quality-index-10-cities-20152025
PM2.5 Distribution, 10 Pakistani Cities, 2015-2025
https://www.kaggle.com/datasets/alitaqishah/pakistan-air-quality-index-10-cities-20152025
Average Annual PM2.5 by Region, 2025
https://www.kaggle.com/datasets/alitaqishah/pakistan-air-quality-index-10-cities-20152025
A Crisis Nobody’s Fully Measuring
Every one of the charts above answers where and how much. None of them answers what it costs a person. A PM2.5 reading doesn’t tell you whether a rickshaw driver worked through it, whether a child’s school shut its doors, or whether a household spent money it didn’t have on an air purifier it couldn’t afford. This is a structural gap in Pakistan’s smog data ecosystem: even the strongest publicly available datasets – including the one behind the charts above – are compiled from annual or monthly aggregates, not built to capture individual-level economic or health costs.
The gap runs deeper than that, though. Reliable ground-level monitoring in Punjab is itself a recent development. As recently as 2024, the province operated only three government-certified air quality monitoring stations; that number has since grown to 59, with officials stating a target of 100. Before 2019, Pakistani authorities published no real-time PM2.5 data at all – what existed came from the US Embassy in Islamabad and its consulates, alongside independent, non-government sensors.
And where government data does exist, the standards built into it can understate the problem it’s measuring. A PM2.5 reading of 60 µg/m³ is classified as “Unhealthy” under the US EPA’s air quality index. The same reading, under Punjab’s own AQI classification, is rated “Satisfactory.” The issue with Pakistan’s smog data isn’t only how much of it exists – it’s what the numbers are permitted to mean once they’re collected.
The Cost of Neglecting Data
This isn’t a purely technical complaint. Data standards in Pakistan’s smog fight have already been litigated, twice. A 2017 public interest petition, filed after mounting public pressure, led the Lahore High Court to order the province to prepare a smog response plan; Punjab subsequently adopted its first Smog Action Plan and AQI classification system that year. In 2019, three youngsters petitioned the same courts, arguing that the government’s own AQI standard was illegal and unreasonable given how far it diverged from internationally accepted thresholds.
Both cases turned on the same question: whose numbers get to count as the truth. That’s the real stake in better data – not simply more accurate dashboards, but a trustworthy evidentiary base that citizens, courts, and researchers can actually build a case on. Without it, accountability has nothing solid to stand on, whether the aim is a legal challenge, a policy redesign, or simply convincing an industrial city’s residents that the air they’re breathing is as bad as it feels.
It also matters for basic economic efficiency. Central Punjab’s textile corridor is both the province’s economic engine and its pollution hotspot; matching public spending and enforcement to where the exposure is actually worst requires data with enough resolution to say so – not an annual snapshot averaged across a province.
The Role of Civic Actors
Some of that gap is now being filled from outside government entirely. The Lahore Smog Collective, a civic archive founded in the aftermath of the city’s 2024 smog season, has been collecting first-person accounts of how residents – students, outdoor workers, parents, healthcare workers – actually experience and adapt to Lahore’s air. Each submission is tagged by variables like location, occupation, and age group, letting the archive be filtered and cross-referenced rather than read as a flat collection of anecdotes – a structure aimed at making the material usable for academics, policymakers, journalists, and civil society groups.
The archive has so far collected close to 100 testimonies from residents across a range of occupations and neighbourhoods.
The project doesn’t claim to replace quantitative monitoring; it sits alongside it. A PM2.5 reading can tell you the air was unhealthy on a given day. It can’t tell you that this was the day a household’s only earner lost a shift, or a child missed a school exam. Lived experience, treated as its own form of evidence, is what closes that gap – at least until official data collection is built to capture it directly.
A $300 Million Bet on Better Air
Government efforts have begun to catch up, at least on paper. Alongside Punjab’s Environment Protection and Climate Change Department’s own mitigation work, the World Bank’s board approved a $300 million loan (through IDA financing) in March 2025 for the Punjab Clean Air Program, targeting the 13 million residents of Lahore Division. Its stated goal is to cut PM2.5 levels by 35% over the next decade, with an official objective centred on strengthening air quality management and reducing population-weighted PM2.5 exposure across the division.
But the same World Bank documentation that describes the program also flags the problem this piece has been building toward: it notes that the EP&CCD – the department responsible for air quality management in Punjab – is under-resourced in personnel, facilities, and systems, and that enforcement of existing policy is limited as a direct result.
A $300 million commitment to cut exposure by more than a third depends on being able to measure, consistently and credibly, whether that reduction is happening – using the same monitoring and enforcement infrastructure the program’s own paperwork admits is still catching up.
What India’s Head Start Actually Shows
Pakistan isn’t alone in its battle with smog, but it most certainly seems to be falling behind in its combat efforts. India’s National Clean Air Programme (NCAP), launched in 2019, began from a similarly thin base: 78 monitoring stations across 38 cities in its 2017 baseline year.
By 2026, that network had grown to roughly 1,646 stations across over 600 cities – a more than twentyfold expansion in under a decade, and a scale-up that dwarfs Punjab’s current 59-station network.
Yet India’s own experience is a caution against treating station count as the finish line. Independent assessments of the NCAP’s progress have repeatedly flagged that data quality and management haven’t kept pace with data quantity – poor maintenance, inconsistent siting standards, and coverage gaps have made it genuinely difficult to attribute air quality improvements to the programme itself, despite years of investment. As one clean-air researcher put it at a recent progress review, pouring money into monitoring systems without equally prioritising data quality and management risks wasting much of that investment.
Punjab’s own trajectory – from 3 stations to 59, with a stated target of 100 – is following the same early curve India walked five years earlier. The lesson from a similarly positioned neighbour isn’t that Pakistan should stop building sensors. It’s that station count alone won’t tell Punjab whether its $300 million clean air program is working, any more than it has told India whether the NCAP is. That answer depends on the harder, less visible work: consistent standards, credible enforcement, and a way of counting what smog actually costs the people living through it – the piece government dashboards still can’t see, and the one the Lahore Smog Collective and groups like it are trying to build from the ground up.
Sources:
1. Taqi Shah, Ali. Pakistan Air Quality Index: 10 Cities, 2015–2025. Kaggle. https://www.kaggle.com/datasets/alitaqishah/pakistan-air-quality-index-10-cities-20152025
2. IQAir. 2024 World Air Quality Report.
3. Punjab Environment Protection & Climate Change Department (EP&CCD), Government of Punjab.
4. World Bank. Pakistan – Punjab Clean Air Program Project. Washington, D.C.: World Bank Group. http://documents.worldbank.org/curated/en/099031125130541245