
One of the major structural issues with the economy that we have discussed is the lack of investment for growth leading to low levels of productivity in Pakistan. As we have discussed in the past, for the last 30 years, GDP has grown by 5.7%, driven by private consumption growing at 6.3% while investment has only grown by 5%.
For Pakistan to grow faster without inflationary pressures, the structural make up of our economy would need to change. Its workers will need to become more productive which can only happen through better education and higher investment by the firms who employ them. We will need to consume less of our incomes, save more domestically and invest those savings in productivity-enhancing initiatives. While we should encourage foreign investments, we need to create an environment of investing that allows foreign firms to come in and collaborate with local firms to improve their capacity and productivity.
This last distinction is important because the previous government did try to increase investments. If you go back to the last post and look at the investment to GDP ratios, you will notice that the number had started to increase again from 14.7% in 2014 to 17.4% in 2018. But the bulk of this increase came from foreign and not domestic savings and our productivity started to drop.
As productivity started to drop, to provide more goods and services, suppliers like you had to increase prices. There were other factors such as a fixed exchange rate and a rising current account deficit, which we will discuss later, but point is that the economy had started to overheat. Since our structural issues still existed, we entered an IMF program that historically encourages stabilization and not growth.
Pakistan has been experiencing growing pains
Pakistan’s GDP vs. growth in GDP and Investment (2015-2020)
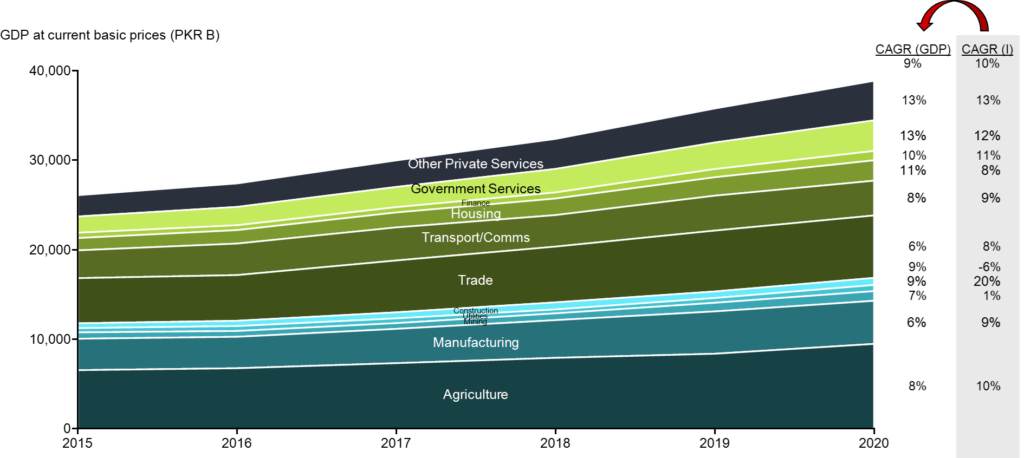
For the Investment to GDP ratio to rise during the previous government’s time, you would expect investment to grow faster than the rest of the economy. And that’s exactly what had been happening with investment growing at roughly 10% since 2015 while GDP grew at a slightly less 9%. What is interesting to note is the difference in growth across various sectors. Each time a sector is growing slower than the overall GDP CAGR of 9%, understand that its contribution to the economy is falling.
We know the expenditure side of the GDP through our CIGXM discussion; now let’s see which sectors Pakistanis spend their money on. Broadly, Pakistan reports data across three main sectors, which each have sub-sectors and further divisions. Agriculture, Industrials and Services are the three main sectors. We will go through the important sectors in detail later but keep some macro takeaways in mind:
- Agriculture is the largest individual sector and while growth in investment is in line with the average of 10% across the economy, growth in its value added to the economy has been slower
- Manufacturing is the biggest sub-sector in Industrials and given it has been the slowest growing sector, we know the country is de-industrializing
- Utilities, which include electricity generation and distribution along with gas distribution, have received the fastest growing investment at 20% but their share of GDP is quite low
- Construction, which is also included in Industrials, has been receiving 6% lower investment each year than the year before
- This has a direct impact on the Service sector of Housing and you should already be hypothesizing that the growth of 11% mentioned for this sector is not real growth
- Other Service sector constituents of Trade, Transport and Communications have all been growing slower than the economy and investment has been lagging behind too
- The biggest growth drivers of the GDP have been Government Services and Private Services, growing at 13% each, which also attracted investments at the fastest pace
Let’s get real again
All the growth numbers mentioned were nominal and not real. So let’s dive into the real world again and specifically talk about productivity. Remember, our role-play: your productivity goes up if you can produce more shirts at the same price and not if you just charge me more for the same number of shirts. Even though both will lead to an increase in your income and my expenditure. For a break from all these words, watch the U.S. Bureau of Labor Statistics explain what productivity is:
To compare the growth in the economy against real output per worker, let’s first explore where the working population of Pakistan is employed.
Pakistan has limited data for its labor force and employment but let’s make do with what we have. The last Labor Force Survey was released in 2017-18 and no update has come ever since. The COVID-19 pandemic has made the authorities realize the importance of this data with fears of rising unemployment so hopefully, going forward, we will put more effort on documenting the working population.
The working age population of Pakistan, which includes people between the ages of 15-64 years, makes up just over 60% of the entire population. Out of this working age population, only 31.7% participate in the labor force, with female labor force participation particularly low at 14.5%. We can discuss the variation of this labor force by provinces and genders later, but for now, let’s continue to focus on the macro overview.
Overall, total labor force was 65.5 million in 2018, out of which 61.7 million were employed and 3.8 million were seeking employment but still unemployed. Hence, Pakistan had an unemployment rate of 5.8%. The largest employer was agriculture (24 m) followed by manufacturing (10 m) and wholesale & retail trade (9 m).
You make me unhappy
Labor productivity in Pakistan by sector (2014 vs. 2018)
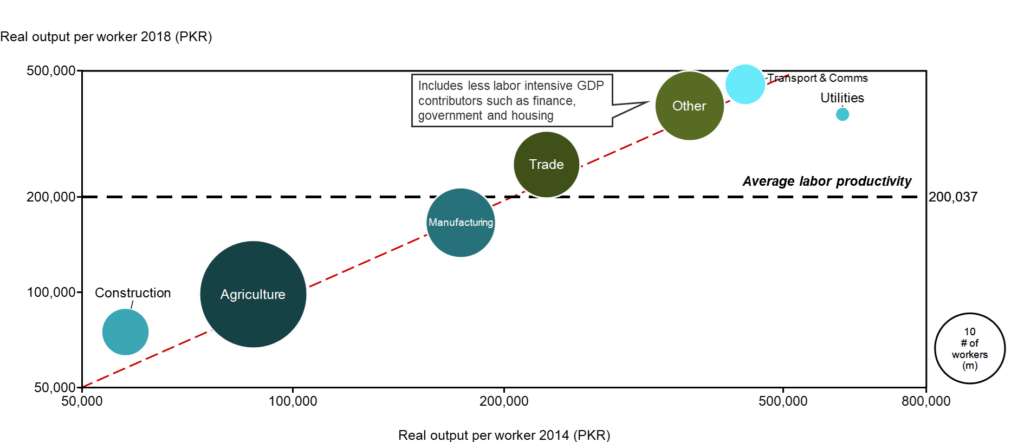
If you compare real output per worker between 2014 and 2018 (can’t do any later because don’t have data), you will see that it has hardly changed. The way to read the graph above is if the circle is on the red dotted line, there hasn’t been much of a change in workers’ productivity in Pakistan. If it has moved up, like in the case of construction, productivity has improved. If it has moved down, like in the case of utilities, productivity has become worse. The size of the bubble shows how many workers are employed in each sector. In 2018, an average worker produced an annual output of PKR 200,000 so if the circle is above the black dotted line, that sector is more productive than the others.
Productivity changes in construction (+30%) and utilities (-40%) are especially telling since the growth in investment as we discussed a few paragraphs ago, was the opposite in Pakistan. Investment in construction contracted by 6% annually while it increased by 20% for utilities. Part of this has to do with the productivity vs. FDI point we made earlier and we will hash it out further when we talk about Independent Power Producers (you must have heard of corrupt IPPs on the news), but for now, understand that you make me very unhappy. The real value add of an average worker in the economy barely changed by 10% in 5 years!
You reap what you sow
At Macro Pakistani, we like to bring in global benchmarks, so let’s dive into our sectoral analysis with the largest employer in Pakistan, agriculture, and see how the limited change in value add compares globally. Note that while agriculture contributes roughly just over 20% to GDP, it contributes almost 40% to the workforce. Meaning workers in this sector are half as productive as other workers in Pakistan.
Global comparison of Agriculture productivity per worker (1995-2018)

In Pakistan, agriculture value add per worker has remained unchanged not just in the last 5 years – it has been practically unchanged for the last 25 years if you notice the green line. During this time, both India and China, which used to produce half as many agricultural goods per worker as Pakistan in 1995, improved their productivity rapidly. China now produces more than twice as many agricultural goods as Pakistan, while India has caught up with us over the years.
I hope all of you can now predict how prices for agricultural products should have changed, given that real output per worker did not increase.
Pakistan’s change in agriculture input and output prices (2012-2019)

Despite input prices for fertilizers, gas and motor fuels for transportation remaining roughly the same since 2012, prices for the output of agriculture products (green line, again not a good thing) have steadily increased year on year. Because demand for agricultural goods has increased with the population on a steady rise, to produce more goods at the same level of productivity you had in 1995, you will have to increase prices.
On a side note: isn’t it nice to see the numbers actually making sense? We’ve come a long way already from our shirt role-play days. If you look at the overall contribution of Agriculture to Pakistan’s GDP, most of the increase can be explained by increase in prices.
Poor Dad Poor Son
We will discuss why the performance of agriculture in Pakistan has lagged behind in the next post but let’s understand the importance of individual worker productivity. Given the productivity of workers in the largest employer of the economy has remained unchanged for the last 25 years, the only way real output can increase would be if the number of workers increased.
Out of the 62 million employed workers in Pakistan, 41 million or 66% belong to rural households. If we want to meaningfully impact productivity in the country, this rural base would need to be addressed. It is important to note that rural areas provide more workers per household as well (1.92 per HH vs. urban average of 1.75), which means their share in the employed labor force is higher than their share in the population.
Pakistan’s labor force break up (2018) and income by type (2019)
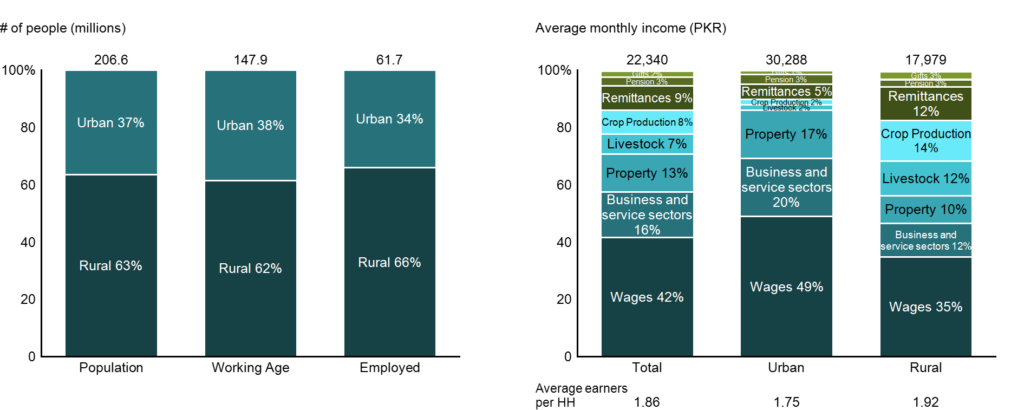
We previously spoke about sources of income in Pakistan overall and found that agricultural income contributes 15% to household incomes, with 8% from crops and 7% from livestock. In rural communities, this share rises to 26%, with crop production bringing in 14% and livestock 12% of incomes. Given the significance of rural workers in Pakistan’s workforce and their reliance on agrarian incomes, agriculture will be the first sector we will dive into next time.
We will explore what impacts agriculture productivity in Pakistan and why it has been unable to bring about a step change in the last few decades. This will help us further our understanding of the structural issues Pakistan faced pre-COVID-19 and what the impact of the pandemic will be.
Highly Insightful Article!
Great work macro Pakistani
We don’t have a macroeconomics blog like this one
Much needed
well researched!